The story
No finance background needed. Two people, one weekend, and the sums behind it.
Friday, 4 pm: the problem
Every Friday at 4:00 pm New York the US stock market closes. It doesn’t reopen until Monday at 9:30 am. That’s 65 and a half hours every week when nobody can buy or sell a US stock on the exchange.
News doesn’t stop for the weekend. When something big happens on a Saturday, a war, a rate cut, a Chinese AI model that spooks the market, it all lands at once when the market reopens. The stock doesn’t slide down during the day where you could react; it simply opens lower. That jump is called a gap, and a stop-loss can’t protect you from it, because the first price it can sell at is already the low one.
Tokenized stocks, like Binance bStocks and Ondo Stocks, are digital versions of the same shares that live on a blockchain. They can move all weekend, but their value still depends on where the real stock opens on Monday. So the weekend risk is still there. Until now, there was simply no way to hand it to someone else.
How Hermee saves her weekend

Meet Hermee. She holds 50 shares of Nvidia as bStocks. At $200 a share, that’s $10,000. She isn’t selling, but she hates the feeling of waking up on Monday to a bad surprise.
- Friday value (50 × $200)
- $10,000
- Monday value (50 × $176)
- $8,800
- Hermee loses
- −$1,200
- Stock falls 12%
- −$1,200
- First 3% is hers (3% × $10,000)
- −$300 of it
- We pay the other 9%
- +$900
- Friday’s fee
- −$2
- Hermee loses only
- −$302
The $900 arrives in her wallet automatically, in USDT, right after Monday’s opening price is published. She still owns her 50 shares, so if Nvidia recovers during the week she gets all of that back too.
And on the other 50 or so weekends of the year when nothing dramatic happens? She loses the $2 and keeps every dollar of whatever the stock did. If Nvidia opens 4% higher, she’s up $400 − $2 = $398. Protection never takes away the good weekends.
- how far it fell, beyond the line
- 12% − 3% = 9%
- times the amount protected
- 9% × $10,000
- capped at 20% of the amount
- most it can pay = $2,000
- Payout
- $900
Try it yourself. Drag Monday anywhere and watch the three numbers change:
protection line at −3%
NVDA opens 8.0% lower. Your stock loses $800, and protection pays you $500. You only lose the first 3% plus the fee.
How Kip makes money
Someone has to pay Hermee the $900. That’s Kip. Kip has $10,000 in USDT sitting idle and would like it to earn something. He puts it into the protection pool together with nine other people, so the pool holds $100,000.
- Stock protected this weekend
- $250,000
- Average fee ≈ $5 per $10,000
- +$125
- Payouts (usually none)
- $0
- Pool earns
- +$125
- Fees: $125 × 52 weekends
- +$6,500
- Paid back on bad Mondays (≈ 57%)
- −$3,700
- Interest on the idle USDT (≈ 4%)
- +$4,000
- Pool earns about
- +$6,800 (≈ 7%)
Kip owns a tenth of the pool, so his share of a typical year is about $680 on his $10,000, or around 7%. Our 21-year backtest found 7.3% a year across all of 2005–2026 and about 10% since 2015. That’s the deal Kip is taking: collect a little every week, and pay out on the rare bad Monday.
Afterwards the pool automatically sells less protection until it earns its way back, because its working half is smaller. That’s the rule that stopped the pool from being wiped out on any start date in 21 years of history, including starting in January 2020.
What happens underneath
Behind the one button there are five steps. None of them needs Hermee or Kip to do anything.
- 1. The price is worked out from real weekends
Our engine has studied 61,815 real weekends across 50 stocks since 2005. It looks at how often weekends like this one (for a stock this jumpy right now) ended past Hermee’s line, and by how much. Say that in weeks like this, 1 weekend in 100 dropped 8%, which is 5% past a 3% line. On $10,000 that’s a $500 payout once every 100 weekends, so the fair price is $5 per weekend. We charge 1.5× that, $7.50, and the extra is what keeps the pool safe in years like 2020. (Hermee paid only $2 in our story because Nvidia was calm that week; jumpy weeks cost more.)
- 2. The price is signed
Our server signs the price with a key, the way a bank stamps a quote. The contract on the blockchain only accepts prices that carry that signature and haven’t expired, so nobody can invent a cheaper one.
- 3. The payout money is locked
When Hermee confirms, her fee goes into the pool and $2,000 (20% of her $10,000) is locked there for her. Kip can’t withdraw it until the weekend is over.
- 4. Friday 4 pm: sales close, the price is recorded
At the bell, no more protection can be bought for that weekend: after the close, news starts to leak into futures markets, and it wouldn’t be fair to the pool. The official Friday closing price, $200, is recorded.
- 5. Monday 9:30 am: settle
The official Monday opening price, $176, is recorded. The contract does the sum from section I.2 (fall of 12%, minus the 3% line, times $10,000 = $900), sends it to Hermee, and unlocks the remaining $1,100 back to the pool. If the stock had a split over the weekend, the weekend is cancelled and Hermee gets her fee back.
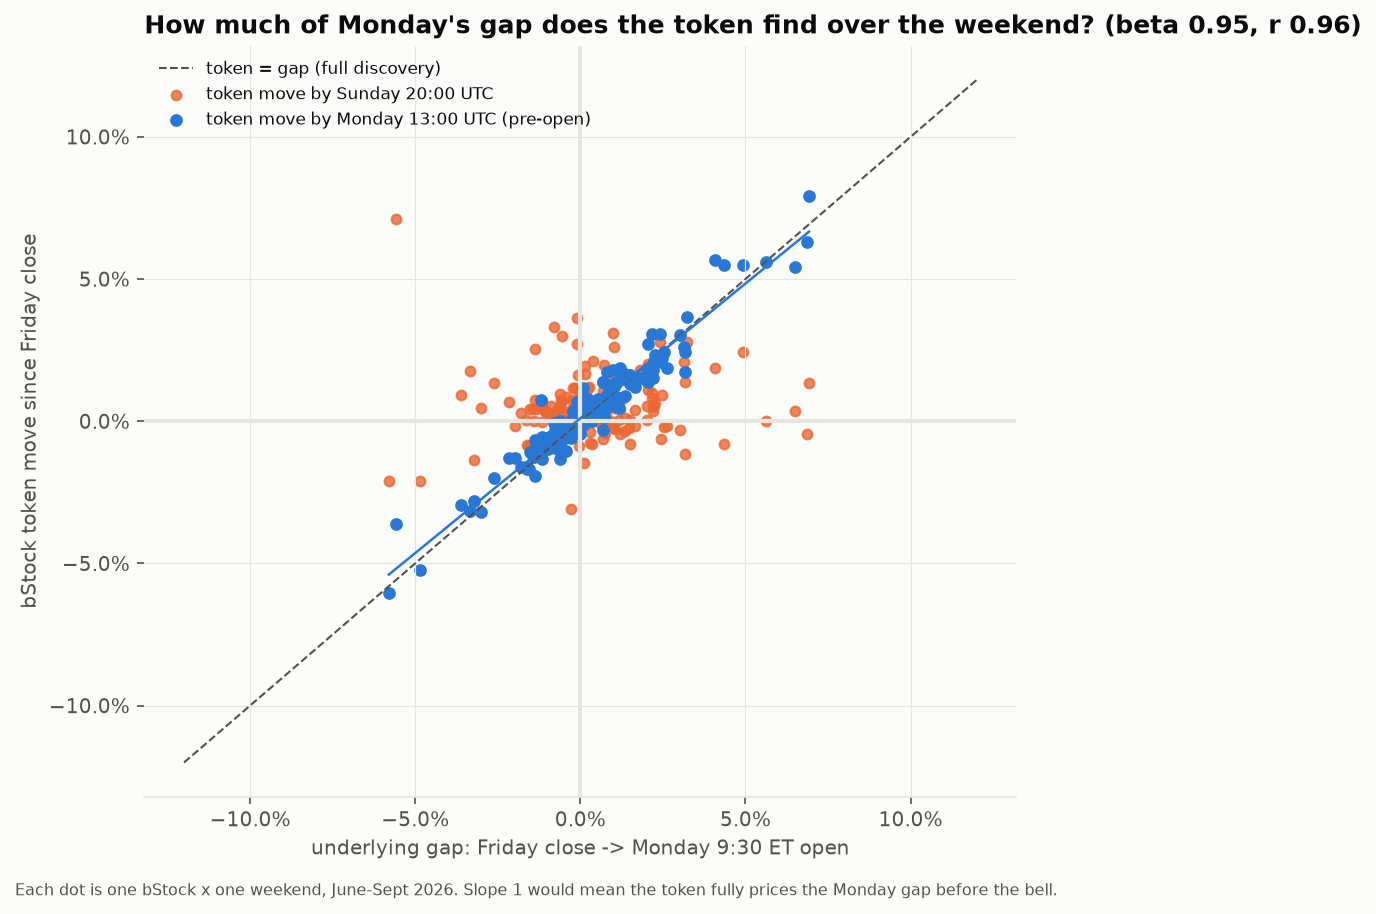
One detail matters more than it looks: we always use the official exchange price, never the token’s own weekend price. Weekend token markets are thin, and we measured that the token discovers almost none of Monday’s move until Monday morning. Using the official price means nobody can push the token around to trigger a payout.
The honest part
- Most weekends Hermee pays a small fee and gets nothing back. Over years, on calm stocks like an S&P 500 fund, that costs a little more than it returns. It’s worth it mainly on jumpy stocks, and for the weekends that would really hurt.
- The payout is capped at 20% of the amount. A 50% crash would still leave a loss beyond that.
- It covers the gap to Monday’s opening price. A fall later on Monday isn’t covered.
- Kip can lose money on a bad weekend, and a few times in 21 years the pool paid out more in a year than it collected.
- Right now this runs on test networks with free test tokens. The admin can pause things and move funds.
The methodology
For researchers and allocators: how the idea evolved, the evidence for demand, the data, the tests, the results for both sides, and how far to trust them.
Abstract
US equities stop trading from Friday 16:00 to Monday 09:30 New York, yet tokenized versions of those stocks (Binance bStocks, Ondo Stocks) trade on-chain all weekend. A holder carries the full weekend gap and has no instrument to shed it. We propose a weekly, fully collateralised protection contract: the holder pays a small fee on Friday and is paid the part of any Monday-open drop beyond a chosen line (capped at 20% of the protected amount), funded by a pool of liquidity providers.
Using 61,815 ticker-weekends across 50 underlyings, we show that weekend gaps are extremely fat-tailed (excess kurtosis 198), that textbook option pricing is mis-calibrated for them, and that a pooled, volatility-scaled empirical engine prices them out of sample with a loss ratio of 0.57 (target 0.67), stable across volatility regimes. Buyers who are even moderately risk-averse are better off insured on volatile names; liquidity providers earn about 7.3% a year on capital with a weekly Sharpe of 0.90, at a one-year ruin probability of 0.4% under the capital rule we enforce.
The intuition, and how it changed
We logged every belief, rejected idea and hard constraint as it happened, with the reason, in RecurOS (our research log). This section is that log, in order. The product we built is not the one we set out to build, and the differences are the point.
- HunchNobody trades time
Commodity traders make money on three dimensions: space (the same barrel is worth more in Rotterdam), form (blending off-spec crude) and time (storing it and selling forward). For stocks, the time dimension has a hole in it every weekend. Tokenization is the first thing that makes that hole tradable. Our first spec, “Weekend Market”, put the idea in three steps: closed-session risk is universal and unpriced; tokenization makes it transferable; and the closed session is where equity returns are made, so whoever carries the risk is “paid twice”: the fee plus the overnight drift.
- First pricingA textbook formula
We first priced protection with the at-the-money approximation
P ≈ 0.4 · σ · S · √T. For Nvidia at 45% volatility over a 65-hour weekend that gives 1.55% of the position: too expensive to buy every week, which told us the product had to be out-of-the-money tail cover, not full hedging. - Test 1The first backtest killed two ideas
One stock (Apple), 2015–2017, 104 weekends. (a) A weekend carried 0.75 of a full trading day’s variance, not the ~0.2 the index literature suggested, so the “retail overestimates weekend risk and we pocket the difference” margin story shrank from 3× to 1.58×. (b) Weekend returns were slightly negative (−1.9% a year, t = −0.28), so “paid twice” was rejected. What survived was stronger: weekend gaps had excess kurtosis 43, and the lognormal model under-priced a 7% drop by a factor of thousands. We repositioned from “a carry trade on a quiet session” to “tail insurance on a risk textbook models cannot price”.
- ConstraintsTwo rules we committed to
From test 1 we wrote two hard constraints into the log: the price must come from data (empirical or extreme-value), never Black-Scholes; and the pool must hold capital of at least 10% of what it covers, with per-stock limits, because one weekend on one stock can exceed any thin buffer.
- Test 2The full backtest
50 stocks and ETFs with bStock or Ondo wrappers, 61,815 weekends, four pricing engines, strictly out of sample. Section 5 and 6 describe it. It confirmed the tail, overturned test 1’s claim that Black-Scholes is uniformly too cheap (it is wrong by regime, not in one direction), and picked the engine we ship.
- ResearchIs it wanted, and is it new?
A market and literature review (section 2) before any code: who carries weekend risk today, what they pay, what already exists, and what 58 academic papers say about pricing it.
- StructureMaking both sides work
Simulations of protection structures for buyers (fixed lines, spreads, yield-funded, fixed budgets) and capital structures for the pool (T-bill collateral, payout caps, junior/senior tranches, dynamic sizing). Tranches were rejected; dynamic sizing was adopted (section 4).
- BuildLive on a test network
Contracts, pricing server and app, with a full Friday-to-Monday cycle settled on-chain: a −7% Monday paid exactly the $40 the formula says on $1,000 protected at a 3% line.
| What we believed at the start | What the data said | Status |
|---|---|---|
| The weekend is a quiet ~0.2 of a trading day | 0.19 to 0.69 of a day by stock (median 0.341) | revised |
| Holders over-pay for weekend risk; that’s the margin | Only 1.58× in test 1; option markets do over-charge weekends, but not enough to be a business on its own | revised |
| The pool is “paid twice” (fee + overnight drift) | Not for single names; the index-level drift has faded since 2021 | rejected |
| Black-Scholes is good enough to price it | Mis-calibrated by regime; over-charges on average, under-charges in quiet periods | rejected |
| Weekend gaps have fat tails | Excess kurtosis 198; 10% drops 137,318× more common than normal | confirmed |
| A 10% capital pool is safe enough | Yes if diversified (0.4% one-year ruin), not for one stock (4.6%) | confirmed, with limits |
Does anyone want this?
Before building we asked three questions: is the risk real, who carries it today, and what do they use instead.
The risk is real, and it lives in the closed session
The most remembered equity losses of 2024–2025 were Monday gaps: Nvidia’s −17% on 27 Jan 2025 after DeepSeek news broke over the weekend (−$589 bn, the largest one-day loss in market value on record), the April 2025 tariff weekend (S&P futures limit-down, VIX 60), and the August 2024 yen carry unwind. The academic literature since French (1980) and Cooper, Cliff & Gulen (2008) finds that most of the equity premium and a large share of variance are realised while the market is closed.
Retail takes the hit; institutions pay, but not for weekends
- In a sample of $15 bn of retail option trades (Bogousslavsky & Muravyev), protective puts are close to absent. Stop-loss orders cannot help against a gap: they execute at the first price after it.
- Institutions spend heavily on downside protection: about $78–87 bn sits in buffer/defined-outcome ETFs, $79.5 bn of buffered annuities were sold in 2025, and roughly $225 bn of US structured notes were issued. All of it is annual and index-level. No listed product isolates Friday close to Monday open.
- Option markets over-charge the weekend: selling Friday-to-Monday index puts earned about two-thirds of a one-day put-writing strategy’s profit (OptionMetrics), and Jones & Shemesh (2018) show equity options are systematically overpriced across non-trading periods. That over-pricing is the margin a well-priced pool can share with buyers.
On-chain, the weekend is where tokenized stocks actually trade
- 92% of on-chain bStock volume in a July 2026 week happened while the US market was closed (Binance Research). Weekend liquidity falls 70–90% and spreads widen 19–33×, and Chainlink equity feeds publish nothing over the weekend by design.
- The institutions already carrying this risk pay for it themselves: Venus keeps a $200,000 “bStock liquidation buffer” for weekends and listed bStocks with zero borrowing; Ethena’s framework for its bStock trade demands 10% extra margin over weekends or flattening before Friday’s close.
- Ondo Stocks mostly cannot be minted or redeemed between Friday evening and Sunday evening, so a holder often has no way out at all. bStocks can be traded 24/7, but the token itself finds almost none of Monday’s move before Monday morning (section 6.6), so selling on Sunday doesn’t help either.
| What a token holder could use today | Why it doesn’t solve the weekend |
|---|---|
| Listed put on the stock | Needs a US brokerage; can’t settle against a token; also covers all of Monday |
| Buffer ETF / structured note | Annual, index-level, off-chain |
| Stop-loss | Fills after the gap, at Monday’s price |
| Short perpetual future | Needs margin and funding; weekend perp prices got Monday’s direction right only 13 of 25 times |
| Sell the token on Sunday | Widest spreads of the week, and the token hasn’t priced the news yet |
The history of bad weekends
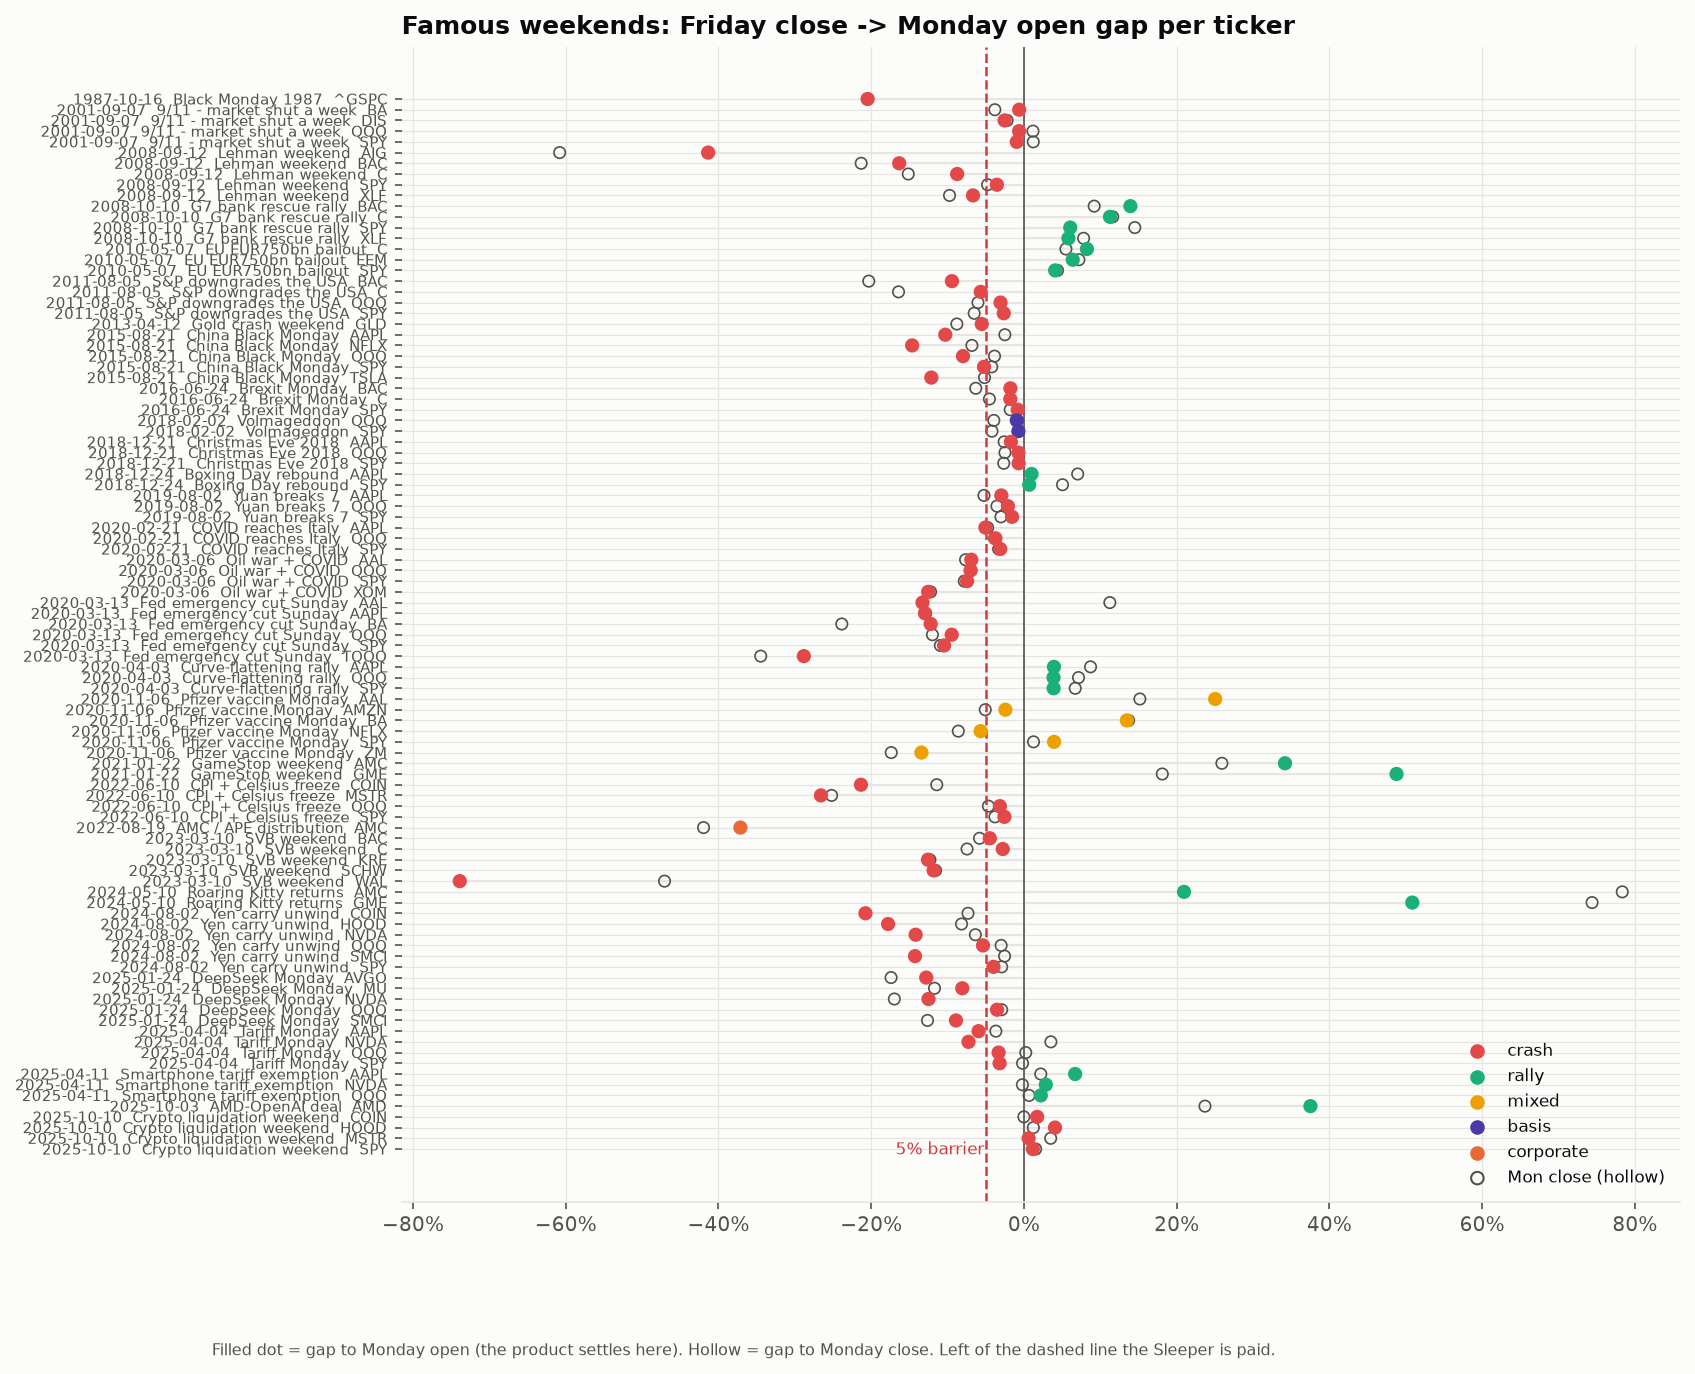
We priced 29 famous weekends exactly as the engine would have on the Friday before, using only data available at the time, for a $10,000 position with protection starting at a 5% drop.
| Weekend | Event | Stock | Monday open | Fee paid Friday | Loss without | Loss with |
|---|---|---|---|---|---|---|
| 2008-09-12 | Lehman weekend | AIG | -41.3% | $50.52 | −$4,135 | −$551 |
| 2008-09-12 | Lehman weekend | BAC | -16.3% | $9.04 | −$1,633 | −$509 |
| 2011-08-05 | S&P downgrades the USA | BAC | -9.4% | $3.10 | −$942 | −$503 |
| 2015-08-21 | China Black Monday | AAPL | -10.3% | $1.49 | −$1,030 | −$501 |
| 2015-08-21 | China Black Monday | NFLX | -14.6% | $5.67 | −$1,463 | −$506 |
| 2020-03-06 | Oil war + COVID | XOM | -12.5% | $4.91 | −$1,254 | −$505 |
| 2020-03-13 | Fed emergency cut Sunday | SPY | -10.4% | $14.55 | −$1,045 | −$515 |
| 2020-03-13 | Fed emergency cut Sunday | AAPL | -13.0% | $25.96 | −$1,296 | −$526 |
| 2020-03-13 | Fed emergency cut Sunday | TQQQ | -28.8% | $151.38 | −$2,882 | −$651 |
| 2020-11-06 | Pfizer vaccine Monday | ZM | -13.4% | $12.06 | −$1,342 | −$512 |
| 2022-06-10 | CPI + Celsius freeze | COIN | -21.3% | $69.64 | −$2,134 | −$570 |
| 2022-06-10 | CPI + Celsius freeze | MSTR | -26.6% | $77.72 | −$2,658 | −$578 |
| 2023-03-10 | SVB weekend | KRE | -12.6% | $2.38 | −$1,257 | −$502 |
| 2023-03-10 | SVB weekend | WAL | -73.9% | $26.72 | −$7,388 | −$527 |
| 2024-08-02 | Yen carry unwind | NVDA | -14.2% | $18.74 | −$1,418 | −$519 |
| 2024-08-02 | Yen carry unwind | COIN | -20.8% | $20.42 | −$2,075 | −$520 |
| 2025-01-24 | DeepSeek Monday | NVDA | -12.5% | $5.51 | −$1,249 | −$506 |
| 2025-01-24 | DeepSeek Monday | AVGO | -12.8% | $1.34 | −$1,279 | −$501 |
| 2025-04-04 | Tariff Monday | NVDA | -7.3% | $11.09 | −$726 | −$511 |
| 2018-02-02 | Volmageddon | SPY | -0.7% | $1.00 | −$73 | −$74 |
| 2021-01-22 | GameStop weekend | GME | 48.8% | $277.39 | $4,879 | $4,602 |
| 2025-10-03 | AMD-OpenAI deal | AMD | 37.5% | $1.00 | $3,752 | $3,751 |
Figures per $10,000 position. Monday open = Friday close to Monday opening price, split- and dividend-adjusted. SVB-weekend banks shown via listed proxies (the failed banks were delisted). Loss with protection = stock move − fee + payout.
Three patterns matter for design. First, the damage is concentrated: across the 99 stock-weekends we priced, the 43 that breached a 5% line account for nearly all of the losses. Second, the fee the engine asked the Friday before was usually small, because a quiet Friday looks quiet (DeepSeek: $5.50 per $10,000), which is exactly why protection has to be bought before you know you need it. Third, some crashes happen during Monday rather than at the open (Volmageddon, February 2018: SPY opened −0.7% and closed −4.2%), so a product that settles at the open must say so plainly.
The two-sided model
Two roles, one contract. We named them to keep the maths human: Hermee holds a stock and buys protection; Kip provides the money that pays for it.
Holds a tokenized stock. Before the Friday bell, pays a one-off fee for one weekend. If Monday opens more than her line below Friday’s close, she is paid the difference on the amount she protected, up to 20% of it. She keeps the stock and all of any gain.
Deposits USDT in a shared pool. Every fee flows to the pool. On a bad Monday the pool pays buyers. Before any protection is sold, its maximum payout is locked, so the pool is always able to pay what it has promised.
The payoff
gap        g = P_open(Monday) / P_close(Friday) − 1         (official exchange prints, per share)
payout     = min( max( −b − g, 0 ), 0.20 )
example    b = 3%, g = −7%   →  payout = 4% of the amount protected
The price (the engine we ship)
Every historical weekend gap in the universe is divided by that stock’s daily volatility over the previous 20 trading days, which puts a quiet utility and a meme stock on the same scale. The resulting pool of 61,815 standardised moves is the engine’s picture of what a weekend can do. To price a stock this week, we rescale that picture by the stock’s current volatility and average the payoff:
z_i        = g_i / σ_d,i                      (σ_d = 20-day daily volatility known on that Friday)
fair(b)    = mean over all prior weekends of  max( −b − σ_d(today) · z_i , 0 )
fee        = max( 1.5 × fair(b) ,  0.01% )     refuse if fee > 2% of the amount
The 50% margin is not profit for its own sake: the backtest says the engine’s expected payout is right on average but noisy weekend to weekend, and the margin is what keeps the pool solvent through the bad years (section 6.3). This is the same idea as Kelly & Jiang’s (2014) pooled estimate of tail risk across stocks, applied to weekend gaps.
The rules that keep it fair
- Sales close at the Friday bell. After 16:00 New York, futures and the overnight session start to reveal the weekend’s news; anyone buying later would be buying with information.
- Settlement uses the official Monday opening price, never the thin weekend token price, which could be pushed around for less than a payout is worth.
- You can only protect what you hold, and corporate actions (splits, halts) cancel the weekend and refund the fee.
- The pool sizes itself. Half of it is a safety reserve that is never put at risk. It can only sell protection whose maximum payout fits inside the other half, so after a bad weekend it automatically sells less until it recovers (constant-proportion portfolio insurance).
Backtest: data and method
Everything below runs from one script and uses only public data. The design goal was that no number could have been fitted to the outcome it is scored against.
| Dataset | Coverage | Used for |
|---|---|---|
| Daily open/high/low/close, split and dividend adjusted (Yahoo) | 50 underlyings, 1990 or IPO → 25 Sep 2026 | Weekend gaps, volatility, pricing, backtests |
| Binance RWA token list (public API) | 1,925 tokenized-stock tokens; 458 Ondo and 80 bStock tokens on BNB Chain | Choosing the universe: every underlying with a live wrapper |
| Binance spot hourly candles | 15 bStocks, Jun–Sep 2026, 165 token-weekends | How tokens behave while the market is shut |
| US 13-week Treasury bill yield | 1990 → 2026 | Yield on the pool’s idle capital |
| Famous-event list | 29 events, 1987–2025 | Case studies (section 3) |
Construction
- Universe. Every underlying that has an Ondo or bStock token on BNB Chain and enough price history: 50 names, 28 of them with a bStock wrapper, 10 ETFs.
- Weekend definition. A closed session that spans a weekend (Friday close → Monday open, or a longer holiday weekend). 61,815 such ticker-weekends; 50,059 single names and 11,756 ETFs.
- Data hygiene. Gaps below −75% were treated as unadjusted corporate actions in the vendor feed and removed (one case, a reverse split). Real distributions such as AMC’s APE units were kept and flagged.
- Out of sample, walk-forward. Every price for a weekend in year Y uses only data from before 1 January of Y; models are refitted yearly. The backtest runs 2005–2026 so that every engine has at least 15 years of history behind its first quote.
- Four engines. Textbook Black-Scholes (two clocks), each stock’s own history, an extreme-value (generalised Pareto) tail fitted per stock, and the pooled volatility-scaled engine.
- Buyer utility. We score protection by the certainty-equivalent return of a buyer with constant relative risk aversion γ = 4: a moderately cautious person. Positive means they’d rather have the protected weekend, fee included.
- Pool risk. 20,000 simulated years made of randomly drawn 4-week blocks of real history (block bootstrap, which keeps the clustering of bad weeks), for pools of different sizes and compositions.
CE = ( mean( (1 + r_w)^(1−γ) ) )^(1/(1−γ)) − 1 r_w = weekend return with or without protectionBacktest: results
6.1 Weekend gaps are extremely fat-tailed
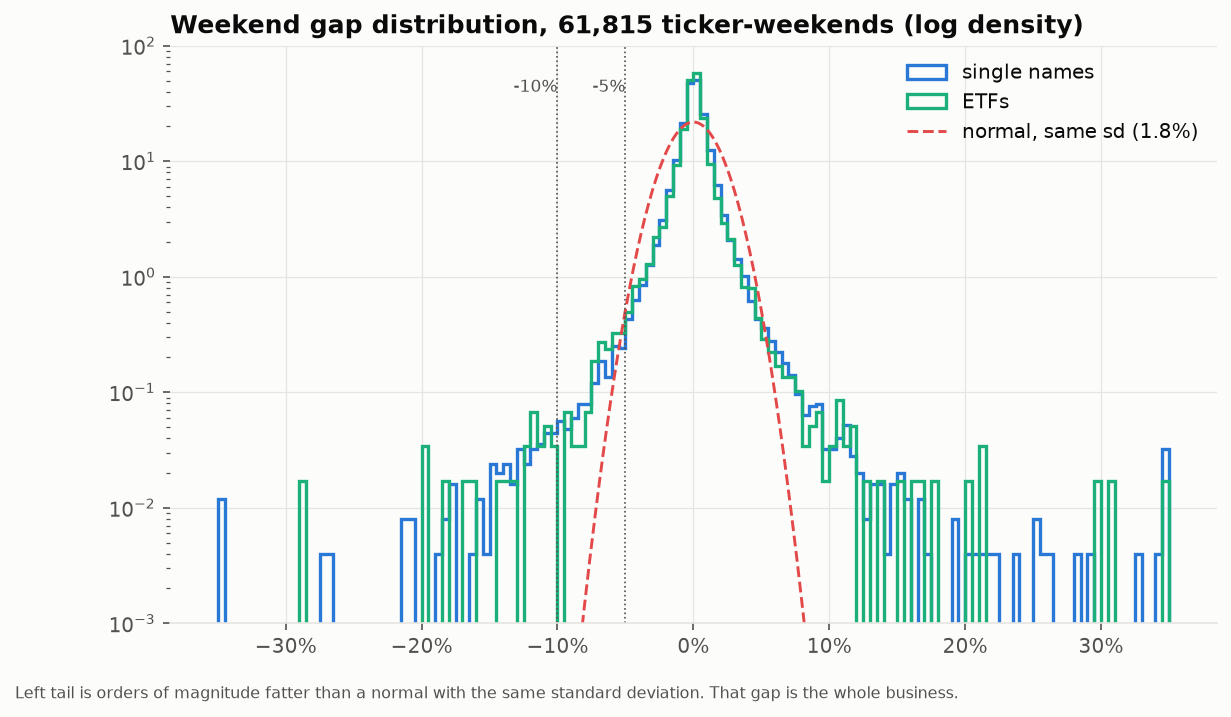
Pooled over all stocks, the typical weekend gap has a standard deviation of 1.8%. If gaps followed a normal curve with that spread, a 3% drop would be common and a 10% drop essentially impossible. Reality is the opposite at both ends: fewer small drops, far more large ones. Excess kurtosis is 198 (a normal curve has 0).
6.2 Which pricing engine survives out of sample
The loss ratio is what the pool paid out divided by what it charged. With a 50% margin, a perfectly calibrated engine lands at 1 / 1.5 = 0.67. Below that it over-charges (buyers overpay); above 1 the pool loses money.
| Volatility regime | BS calendar | BS trading | Own history | Extreme value | Pooled ★ |
|---|---|---|---|---|---|
| Calmest fifth | 0.02 | 0.03 | 0.02 | 0.02 | 0.03 |
| 2nd fifth | 0.20 | 0.45 | 0.25 | 0.22 | 0.54 |
| Middle fifth | 0.08 | 0.28 | 0.22 | 0.20 | 0.56 |
| 4th fifth | 0.07 | 0.25 | 0.47 | 0.41 | 0.67 |
| Wildest fifth | 0.10 | 0.21 | 1.46 | 1.26 | 0.58 |
Loss ratio by the stock’s volatility in the 20 days before the weekend (BS = Black-Scholes; ★ = the engine we ship). A per-stock history doesn’t know volatility just tripled, so in the wildest fifth of weeks it pays out 1.3–1.5× what it charged. The pooled engine is level from the second quintile up. (In the calmest fifth almost nothing breaches, so every engine’s ratio is near zero and the 1-cent-per-$100 minimum fee does the work.)
6.3 Is the shipped engine calibrated?
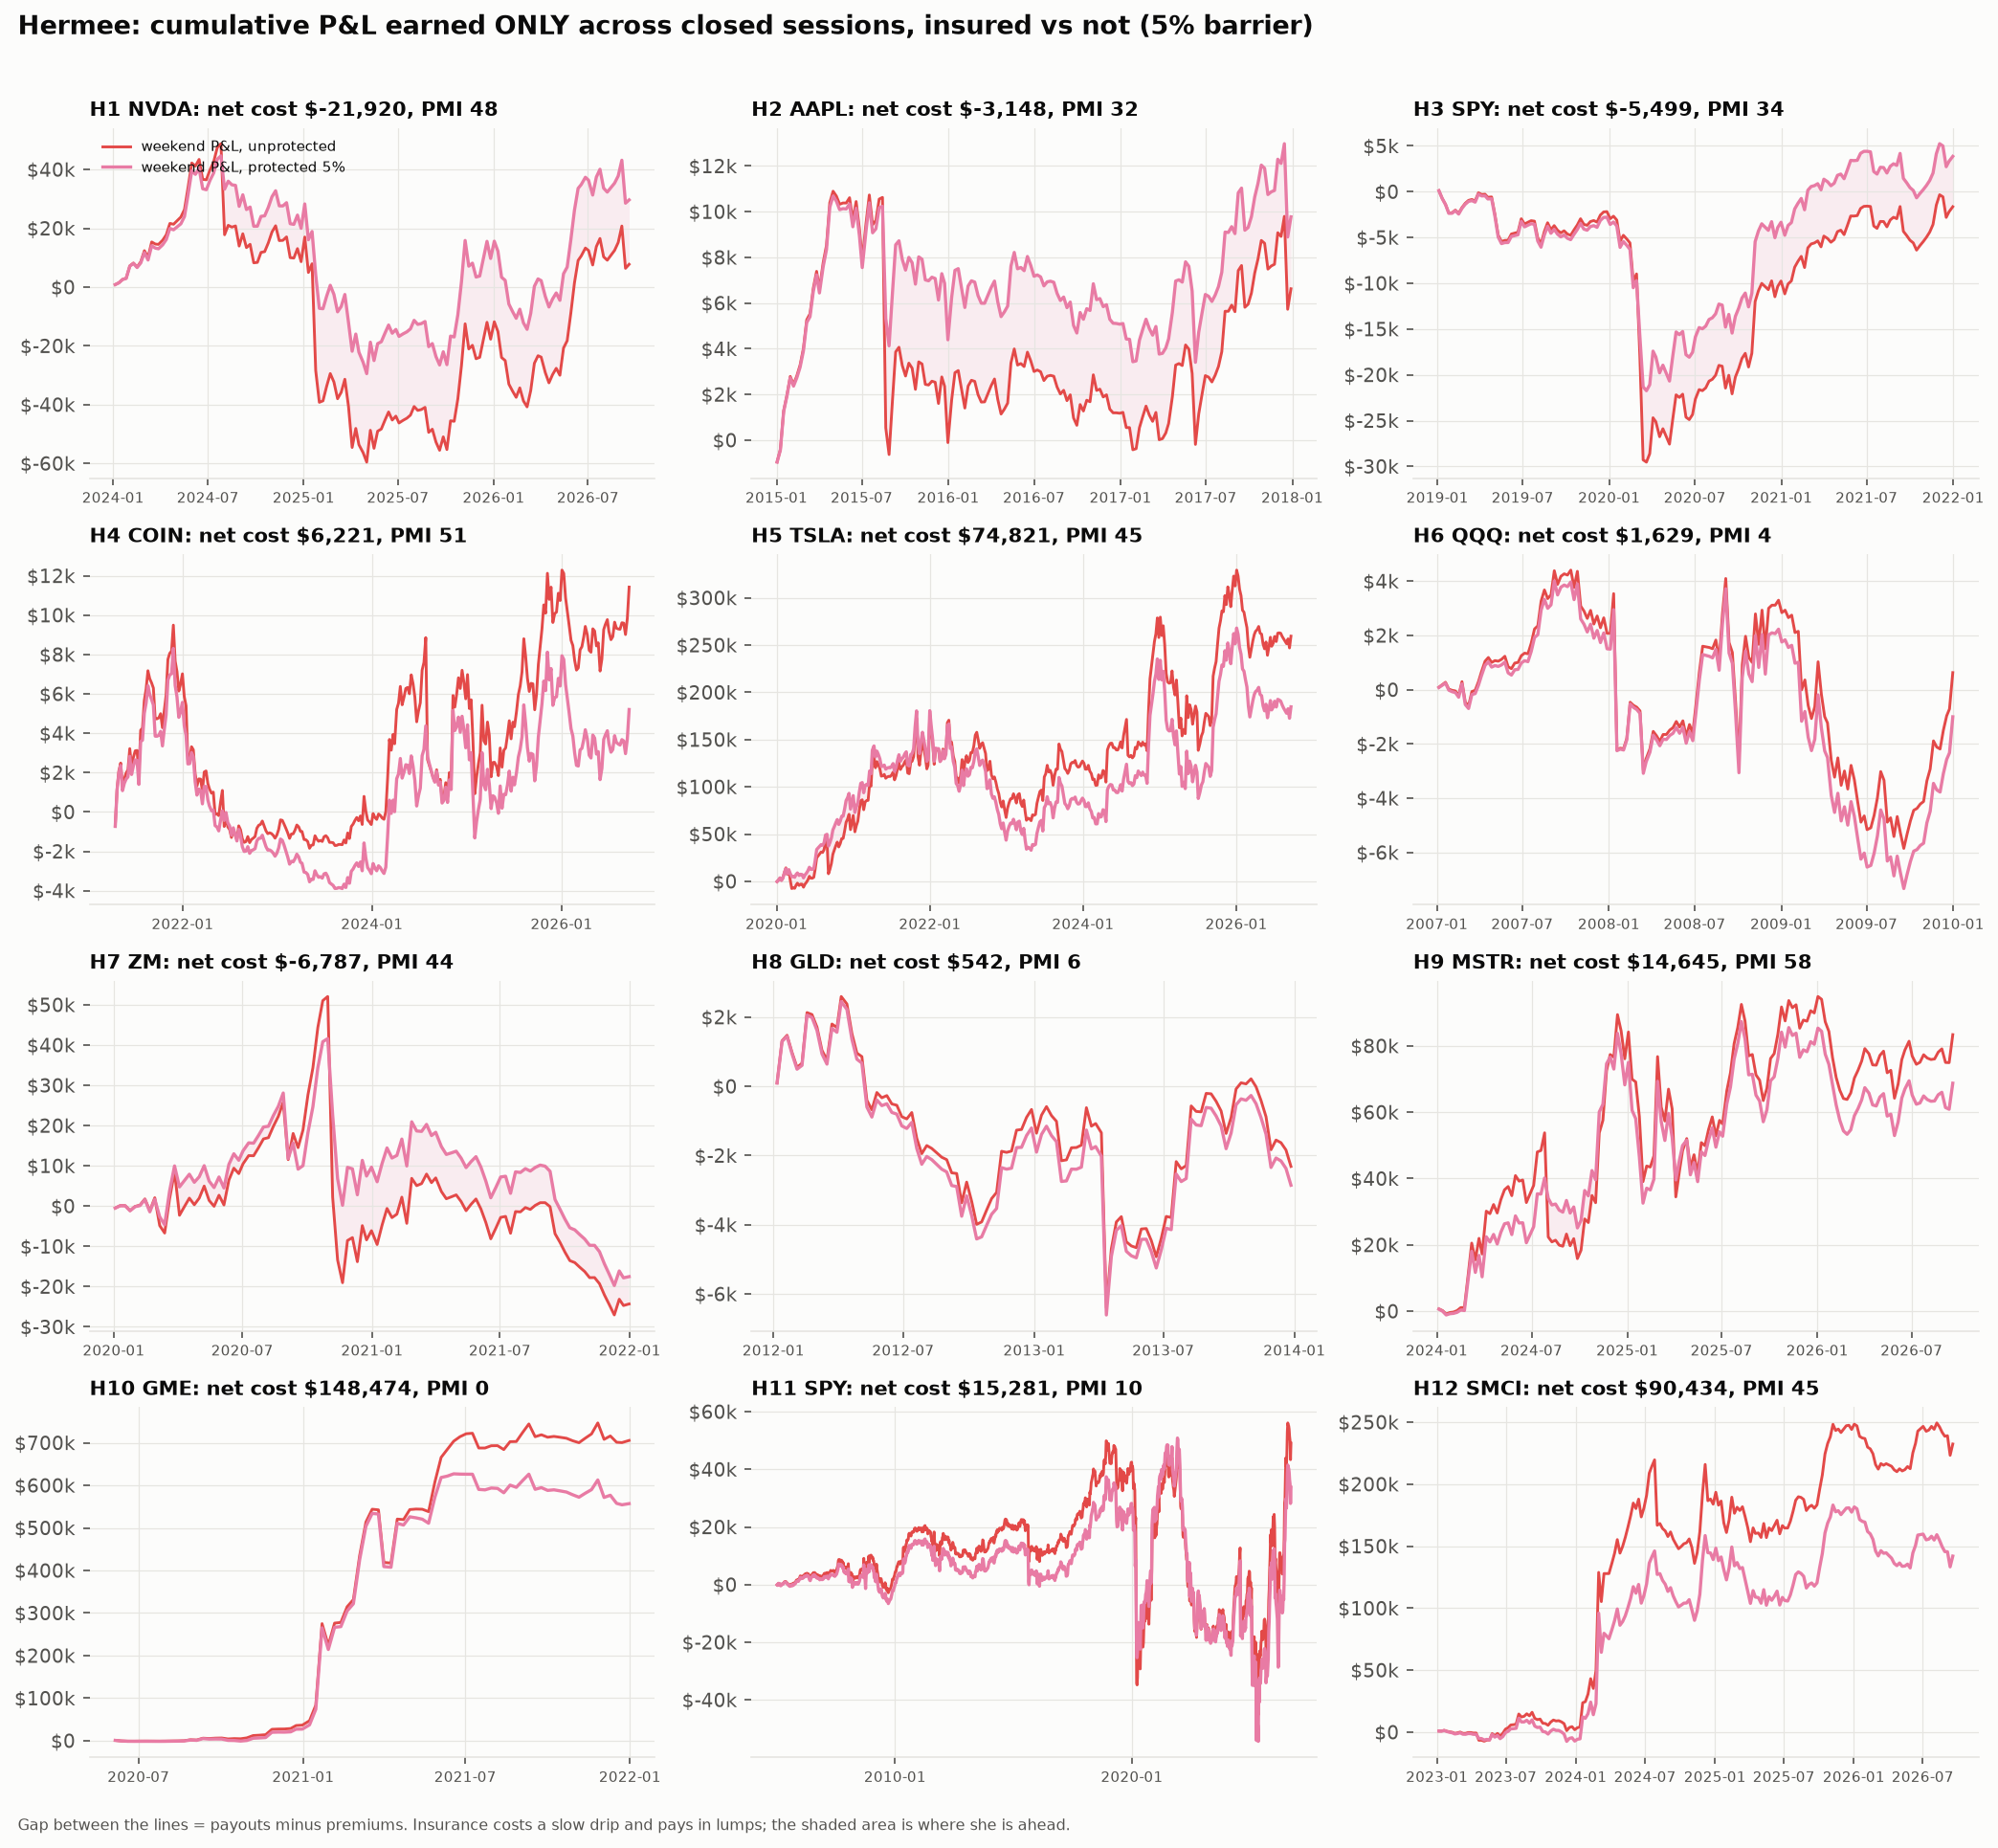
6.4 The buyer: twelve people who held a stock
| Holder | Period | Fees paid | Paid back | Worst weekend | Worst, protected | Worth it? |
|---|---|---|---|---|---|---|
| NVDA · $100k | 2024–2026 | $24,265 | $46,184 | −$36,306 | −$14,689 | yes |
| AAPL · $100k | 2015–2017 | $2,041 | $5,189 | −$10,087 | −$4,913 | yes |
| SPY · $100k | 2019–2021 | $3,367 | $8,866 | −$11,361 | −$6,030 | yes |
| COIN · $50k | 2021–2026 | $15,826 | $9,604 | −$6,203 | −$2,186 | yes |
| TSLA · $50k | 2020–2026 | $161,496 | $86,674 | −$40,800 | −$35,054 | yes |
| QQQ · $100k | 2007–2009 | $2,206 | $577 | −$5,764 | −$5,197 | no |
| ZM · $50k | 2020–2021 | $34,358 | $41,145 | −$49,874 | −$18,944 | yes |
| GLD · $100k | 2012–2013 | $1,021 | $479 | −$5,057 | −$4,588 | no |
| MSTR · $50k | 2024–2026 | $72,770 | $58,125 | −$31,402 | −$14,447 | yes |
| GME · $25k | 2020–2021 | $148,474 | $0 | −$123,490 | −$123,490 | no |
| SPY · $100k | 2005–2026 | $40,796 | $25,515 | −$32,095 | −$26,052 | no |
| SMCI · $50k | 2023–2026 | $166,267 | $75,833 | −$52,767 | −$31,574 | no |
Fixed number of shares bought at the start, protection bought every weekend at the engine’s price, 5% line. “Worth it” = a moderately risk-averse holder (γ = 4) prefers the protected weekends, fees included. A holder refuses any weekend where the fee would exceed 2% of the position (this happened 14 times for GameStop in 2021).
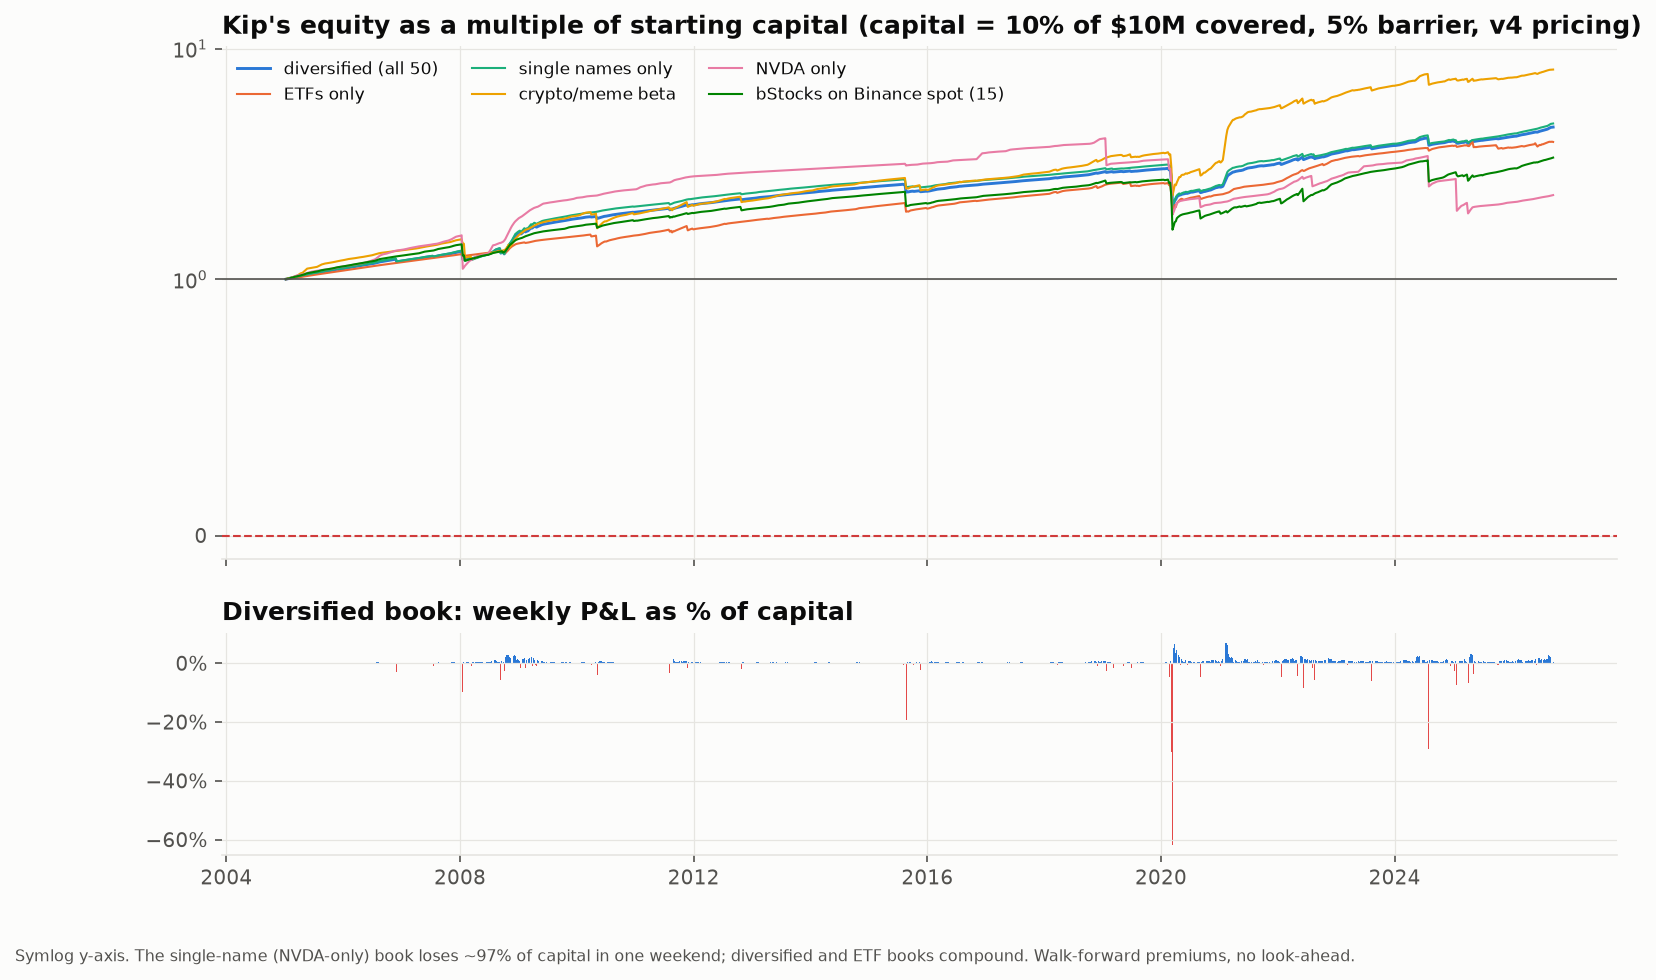
6.5 The pool: 22 years of underwriting
| Pool composition (10% capital) | Return / yr | Weekly Sharpe | Worst weekend (% of capital) | Max drawdown | 1-yr ruin |
|---|---|---|---|---|---|
| diversified (all 50) | 7.3% | 0.90 | -62% | -32% | 0.4% |
| ETFs only | 6.5% | 0.95 | -39% | -26% | 0.1% |
| single names only | 7.4% | 0.85 | -69% | -33% | 0.9% |
| crypto/meme beta | 10.1% | 0.94 | -80% | -35% | 2.4% |
| NVDA only | 4.0% | 0.15 | -97% | -53% | 4.6% |
| bStocks on Binance spot (15) | 5.8% | 0.45 | -64% | -39% | 1.4% |
$10 M of protection sold every weekend across the pool’s stocks, capital = 10% of that, idle capital earning 4%. Ruin = capital exhausted within 52 weeks, from 20,000 bootstrapped years. Diversification, not capital, is what separates a safe pool from an unsafe one.
A static pool at 10% capital survives every historical start date, but 13 March 2020 (the Sunday emergency rate cut) cost it 62% of its capital in one weekend. With the dynamic sizing we enforce (sell at most 10× the cushion above a 50% reserve), the same pool’s value never fell below 100% of its starting capital in the historical run, the reserve held in all 20,000 simulated years, and the median year returned 10.6%. We also tested splitting the pool into senior and junior slices; the senior slice was still hit in about 4% of years at every split, because a 2020-type year exceeds any junior slice. We rejected it.
6.6 What the token does while the market is shut
Across 165 bStock weekends, the token’s move by Monday 13:00 UTC (30 minutes before the open) explained Monday’s gap almost perfectly (slope 0.95, correlation 0.96), but its move by Sunday night explained essentially none of it (slope 0.02). Price discovery happens in Monday pre-market, when futures and the overnight session trade. Thirty minutes before the bell the token sat within 0.31% of the official open on a typical weekend and within 0.84% at the 90th percentile.
Conclusions for both sides
A two-sided market only works if both sides are better off. The backtest says they are, for a clear set of buyers and under a clear set of rules for the pool.
- On volatile names the protection is worth more than it costs to a cautious holder. Holding $100k of Nvidia 2024–2026 she paid $24,265 and was paid $46,184; her worst Monday went from −$36,306 to −$14,689.
- Zoom through the vaccine Monday: worst weekend −$49,874 → −$18,944.
- On calm index funds in calm periods it is a small tax for little relief (21 years of SPY: 0.20% a year). We say so in the app rather than hide it.
- The shape that was worth it for every kind of stock was a fixed weekly budget that buys the tightest line it can afford that Friday.
- The pool keeps what it doesn’t pay out: with a loss ratio of 0.57, about 43% of every fee is profit over time.
- A diversified pool returned 7.3% a year on capital 2005–2026 (10% since 2015), with a weekly Sharpe of 0.90, losing money on about 6% of weekends.
- The risk is real and named: one weekend in 2020 cost a static pool 62% of its capital. Dynamic sizing and a 50% reserve keep that from becoming ruin.
- It prices below the alternatives buyers have (listed Monday puts, 10% extra weekend margin), so the pool is sharing the weekend over-pricing that already exists, not inventing a new one.
Technology
Kept deliberately simple: research and production share the same model, and nothing in between is hand-tuned.
| Part | Built with | What it does |
|---|---|---|
| Research pipeline | Python: pandas, NumPy, SciPy, Matplotlib | Data pulls, the four engines, backtests, bootstrap, all charts on this page |
| Market data | Binance Web3 RWA API, Binance spot API, Yahoo Finance | Which tokens exist, live prices and volatility, market open/closed status |
| Contracts | Solidity, OpenZeppelin, Hardhat | Pool, protection market and price oracle; verified on BscScan |
| Pricing server | Node.js, TypeScript, viem, MongoDB | Runs the shipped engine live, signs each price, posts Friday and Monday prices, settles |
| App | Next.js, wagmi, RainbowKit | The interface you’re reading |
| Research log | RecurOS | Every decision and rejected idea, with its reason, in order |
| Networks | BSC Testnet (via Alchemy) | Where it runs today |
The server runs the same pooled, volatility-scaled formula as the backtest, from the same 61,815-weekend history, with this week’s volatility measured live from the bStock’s own trading. Each price is signed, so the contract accepts only prices the engine produced, and only before the Friday bell.
How far to trust the numbers
What we validated, what we corrected, and what we know is biased.
Validated
- Out of sample. No price in any table was fitted on the payouts it is scored against; every engine is refitted once a year on prior data only.
- Calibration. The shipped engine’s predicted and realised payouts line up by decile (figure 6.4), and its loss ratio is level across volatility regimes from the second quintile up.
- Stress. Pool results come from 20,000 bootstrapped years and from starting the pool on the worst historical dates (just before 2008, 2015, 2020 and 2024).
- On-chain. A full cycle was run on the live contracts: $1,000 protected at a 3% line, Monday −7%, payout exactly $40.00 as the formula says.
- Consistent with the literature. Pooling tails across stocks (Kelly & Jiang 2014), scaling by current volatility (McNeil & Frey 2000), treating the weekend as roughly one trading day of variance (French & Roll 1986), and the finding that weekend options are overpriced (Jones & Shemesh 2018) all match what we built.
Corrected along the way
While testing the live app we found the server was measuring a bStock’s volatility over all seven days of its 24/7 trading and annualising it as if every day were a trading day. Quiet Saturdays and Sundays pulled the estimate down (Nvidia read 21% against 46% on the exchange), which would have under-priced protection by up to half. The live estimate now uses weekday closes only, matching how the engine was calibrated. We report it because this is the kind of error a backtest cannot catch and only a live system can.
Known limitations
- Survivorship. The universe is today’s tokenized list, so stocks that failed (SVB, First Republic, Lehman) are missing. The measured tail is therefore a lower bound on the real one.
- Few extreme events. Most of the pool’s losses come from a handful of weekends; any figure that depends on them (worst weekend, ruin) has wide uncertainty even with 22 years of data.
- Opening prints are noisy. The official open is the reference the market publishes, but opening auctions are noisier than closes. A 15-minute average is the next thing to test.
- Scheduled events. Earnings weekends are known jumps, not tail risk; the production rules refuse or surcharge them rather than rely on the model.
- Token history is short. bStocks launched in June 2026; the token-behaviour results rest on 165 weekends, and Ondo’s on-chain history could not be retrieved.
- Vendor data. Daily prices come from a free vendor with occasional corporate-action errors; we removed the one we found and flagged the rest.
backtest/run_all.ps1). Results, charts and a longer technical report live alongside it.References
- French, K. (1980). Stock returns and the weekend effect. Journal of Financial Economics 8(1).
- French, K. & Roll, R. (1986). Stock return variances: the arrival of information and the reaction of traders. Journal of Financial Economics 17(1).
- Cooper, M., Cliff, M. & Gulen, H. (2008). Return differences between trading and non-trading hours: like night and day. SSRN 1004081.
- Lou, D., Polk, C. & Skouras, S. (2019). A tug of war: overnight versus intraday expected returns. Journal of Financial Economics 134(1).
- Boyarchenko, N., Larsen, L. & Whelan, P. (2023). The overnight drift. Review of Financial Studies 36(9); and (2026) The disappearing overnight drift, Liberty Street Economics.
- McNeil, A. & Frey, R. (2000). Estimation of tail-related risk measures for heteroscedastic financial time series: an extreme value approach. Journal of Empirical Finance 7.
- Kelly, B. & Jiang, H. (2014). Tail risk and asset prices. Review of Financial Studies 27(10).
- Jones, C. & Shemesh, J. (2018). Option mispricing around nontrading periods. Journal of Finance 73(2).
- Black, F. & Perold, A. (1992). Theory of constant proportion portfolio insurance. Journal of Economic Dynamics and Control 16.
- Balder, S., Brandl, M. & Mahayni, A. (2009). Effectiveness of CPPI strategies under discrete-time trading. Journal of Economic Dynamics and Control 33.
- Sydnor, J. (2010). (Over)insuring modest risks. American Economic Journal: Applied Economics 2(4).
- Bogousslavsky, V. & Muravyev, D. An anatomy of retail option trading. SSRN 4682388.
- Binance Research (2026). Tokenized stocks: weekend price discovery analysis.
Nothing here is investment advice. Figures are historical and hypothetical; the product runs on test networks. Back to the plain-English story.